Behind the scenes: The 2020 Automotive Fuel Cell Roadmap
An automotive fuel cell stack could cost $20/kW by 2035, two centuries after the invention of the fuel cell. How do we know this? The new Fuel Cell Technology Roadmap, published on the 19th November by the Advanced Propulsion centre on behalf of the Automotive Council and supported by the Department for Business, Energy and Industrial Strategy.
A Toyota Mirai has a system rated power of 90kW and can store 5kg of hydrogen. Based on the below targets, the fuel cell system and storage tank combined would currently cost Toyota about the same as the selling price of a new VW Up! However, these cost barriers are forecast to fall significantly with higher demand and production. Maybe by 2035, I can afford a fuel cell car.
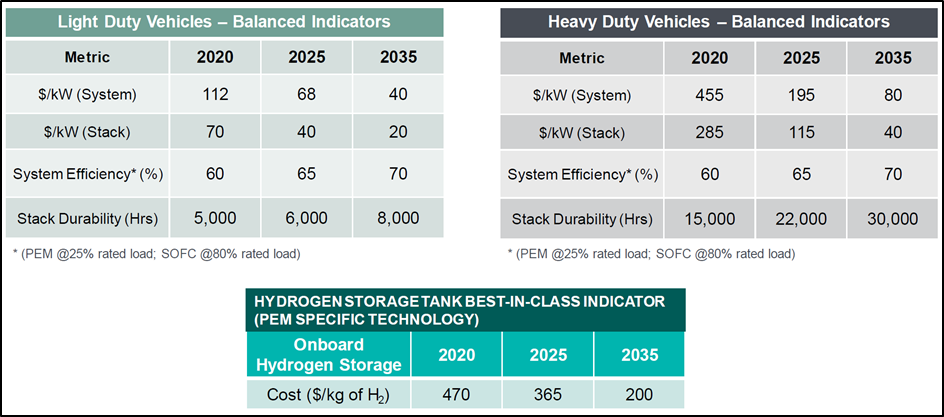
Here’s a summary of the targets from the Fuel Cell Technology Roadmap:
But where do these numbers come from? The simple answer is that the fuel cell targets are based on market research and benchmarking. However, behind the scenes, there is a lot more to consider.
What am I looking for?
As an analyst, I worked on the earlier stages of estimation. First comes the “What am I looking for?” stage, where I am given specific fuel cell metrics to research. I initially prioritised cost ($/kW), power density, durability and efficiency. Filtering by these, I searched for existing government and industry reports that cover these fuel cell targets for both light-duty (< 3.5 tonnes) and heavy-duty vehicles (> 3.5 tonnes).
Most forecasts focus on proton exchange membrane fuel cells (PEMFC) for automotive applications. However, feedback from the APC’s industry workshops has shown that developments in solid oxide fuel cells (SOFC) are significantly mature and capable of delivering automotive applications. The UK is strong in both technologies.
The United States, Japan and China have already published targets in their fuel cell and hydrogen roadmaps. An excellent report published by CellPress provides a useful comparison of these (see Table S6 in the report). The EU’s Fuel Cells and Hydrogen Joint Undertaking (FCHJU) has also outlined targets by automotive application.
The APC recognises that the work of our international partners is key in target-setting. In my preliminary estimations, I graphed existing international targets as shown in figure 1.1 below. This helps me identify trend lines and any anomalies in the data.
While the following example is for system-level costs, the same approach was used in estimating other fuel cell indicators.
Reading the assumptions
Looking at the graph below, the light-duty cost targets converge the further they go into the future. However, cost reductions are not driven by time itself. This convergence is due to alignment in the production assumptions. Analysing these is as important as the data comparison itself.
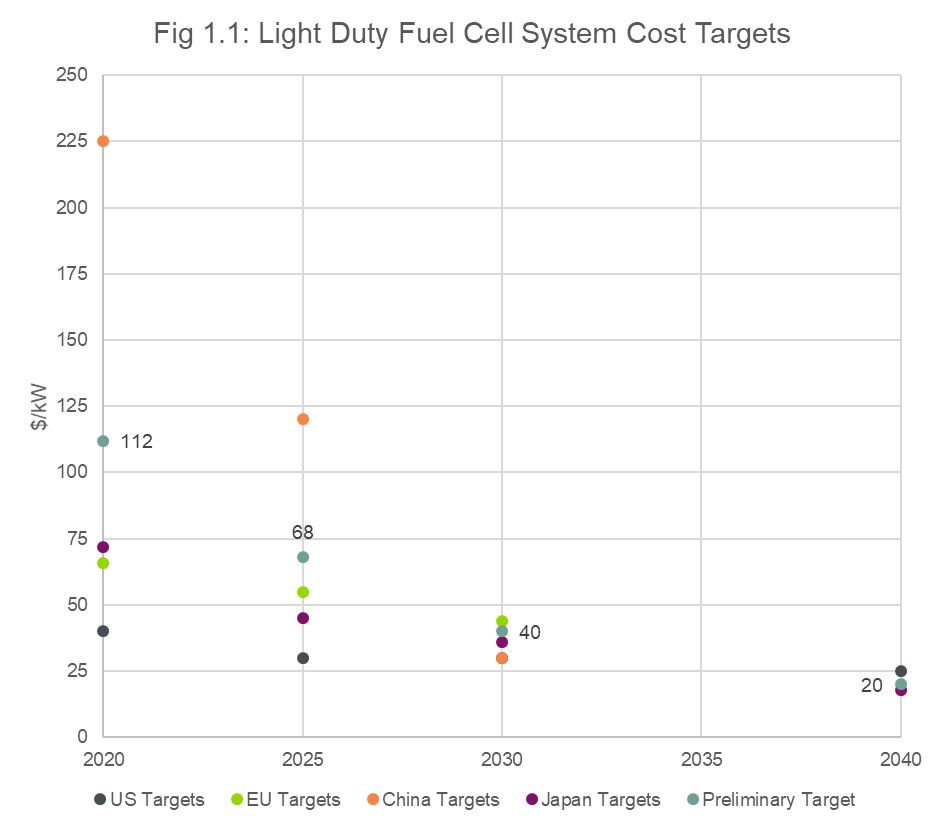
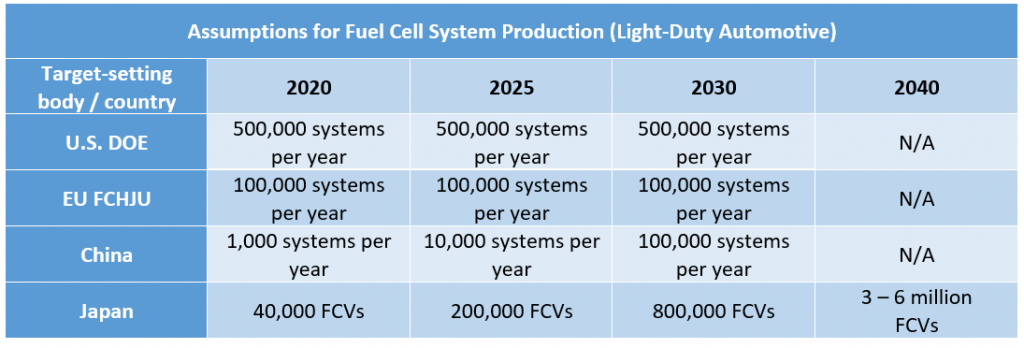
You will notice that the U.S. Department of Energy (DOE) system cost targets are relatively ambitious in 2020 and 2025. These are based on a cost study by Strategic Analysis (2017), which assumes annual mass production of 500,000 fuel cell systems (equivalent to 500,000 FCVs). Putting this into perspective, Toyota forecasts global annual sales to reach 30,000 FCVs in the 2020s. Therefore, the DOE volumes are currently unrealistic but provide a good trajectory beyond 2030.
The Strategic Analysis report (2017) does say that the DOE 2020 target is “based on projected 2020 laboratory demonstrated technologies”. This means it is a research target and not commercially-viable today. However, the 2025 target is based on a “high innovation” scenario where fuel cell technology development is well-funded.
The U.S. DRIVE Fuel Cell Roadmap (2017) states that these low-cost DOE systems “do not necessarily meet other system-level targets”. Therefore, the cost target is not a “balanced indicator” and in reality it would be higher to achieve a better system efficiency for example.
A recent review by Strategic Analysis (2020) concludes that both the $40/kW (2020) and $30/kW (2025) DOE system targets are very difficult to achieve and would require “substantial performance improvements” and “much lower material costs”.
The EU targets from the FCHJU follow a similar methodology to the DOE, with system cost targets based on constant high-volume production of 100,000 systems per year. These are $66/kW in 2020, $55/kW in 2024 and $44/kW by 2030*. The system rated power is not specified but assumed to be 80kW in line with the DOE targets.
In contrast, China’s system cost targets are more conservative for 2020 ($225/kW) and 2025 ($120/kW). This is because their annual production assumptions are 1,000 and 10,000 systems per year respectively. However, their roadmap states that Chinese technology developers will accelerate expansion plans to reach a capacity of more than 100,000 fuel cell systems by 2030. This will help them achieve $30/kW in the same year. The roadmap adds further detail on increasing the system’s rated power from 60kW in 2020 to 75kW and 100kW by 2025 and 2030 respectively.
Japanese targets are also based on a “scale-up” approach in fuel cell vehicle production. Japan’s hydrogen strategy assumes the number of Japanese fuel cell vehicles (FCVs) will reach 40,000 by 2020, 200,000 vehicles by 2025, and 800,000 by 2030. These production levels will create demand to drive cost reductions in light-duty fuel cell systems from $72/kW in 2020, $45/kW in 2025 to $36/kW by 2030. Ultimately, Japan forecasts 3 – 6 million FCVs in operation by 2040, with a fuel cell system cost of $18/kW. I was unable to find the rated power assumption for these system-level targets.
As you can see, the difference in production assumptions is significant. I prefer the Chinese and Japanese roadmaps because they explain how they plan on getting from A to B. Their roadmaps also acknowledge the U.S. DOE and FCHJU targets, which I think shows a positive attitude to collaboration.
A summary of each international partner’s assumptions is outlined below:
Using the data to guide initial estimates
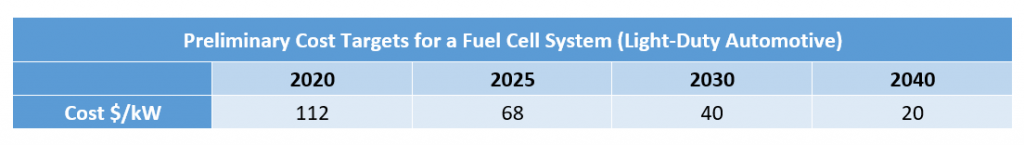
After considering the above assumptions, I focused on the data. Averaging all four targets for 2020 led to an estimated system cost of $100/kW. However, this is biased downwards by the DOE and FCHJU targets. Without the DOE target the average was $121/kW, biased upwards by the Chinese target. Therefore, a preliminary estimate of $112/kW between the two averages was a sensible starting point. For 2025, the same method was applied with an estimated $68/kW between $63/kW and $73/kW.
The approach was different for 2030 because the cost targets converge significantly by this point. This is also the year where China ($30/kW) and FCHJU ($44/kW) production assumptions are equal at 100,000 systems per year. In this case more weight was given to the EU’s FCHJU target to reach an estimate of $40/kW.
There is not much data for 2040, but the Japanese roadmap does go this far and targets $18/kW. Using this as the base target along with data from other sources, a preliminary cost target of $20/kW was suggested.
The preliminary cost targets for light-duty vehicles are summarised in the following table:
From the above estimation, I determined that fuel cell system costs are very sensitive to production capacity. A learning rate represents this relationship between production volumes and cost. For example, BloombergNEF estimates an 18% learning rate for batteries based on historical price values. This means that if a battery manufacturer were to double its production, they would see an 18% reduction in the battery cost.
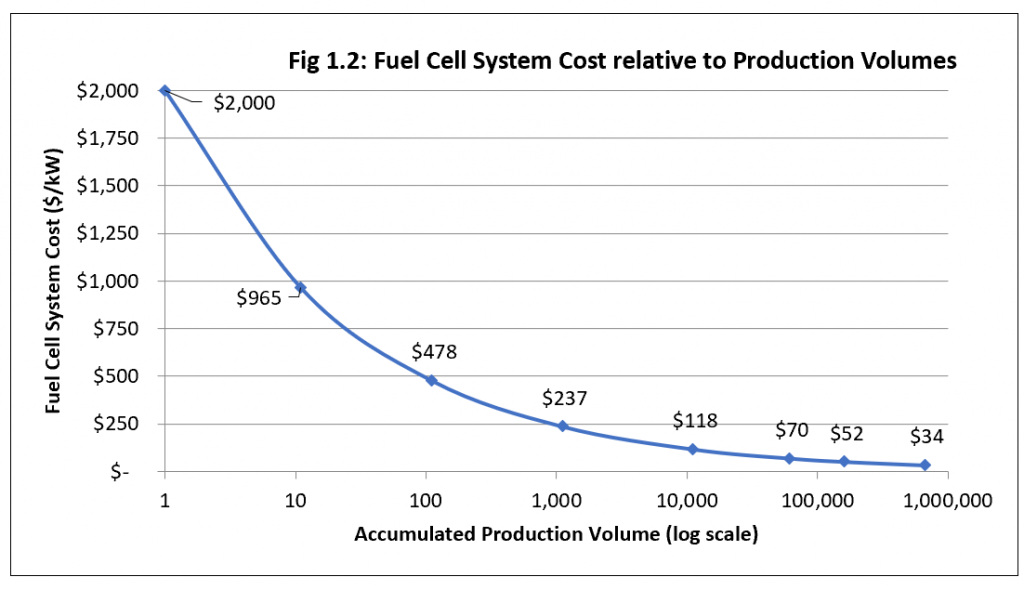
Assuming a 19% learning rate for fuel cells, the cost curve in figure 1.2 was generated based on a $2,000/kW prototype system. The projected cost at 1,000 systems per year is close to the $233/kW estimated for the 2017 Toyota Mirai at the same production level (Strategic Analysis, 2017). The cost curve beyond 1,000 units is also broadly in line with the preliminary cost targets.
In the end it is not time that makes things cheaper but the number of units you manufacture. Waiting is not an option.
Although I’m just the analyst, I work with an experienced team at the APC who checks these initial targets before consulting industry and academia experts. This was the next step in the process.
Asking industry experts what they think
After completing the initial estimates, it was time to ask the fuel cell experts if they thought these were sensible targets.
The APC runs numerous workshops for each technology and product roadmap. The purpose of these is to achieve consensus across industry experts with the support of APC Spoke Communities. Engaging the fuel cell community has been an exciting addition to the 2020 roadmapping process.
That said, the preliminary targets were subject to initial consultation before being presented in the workshops. There were some early suggestions to prioritise different metrics as seen below.
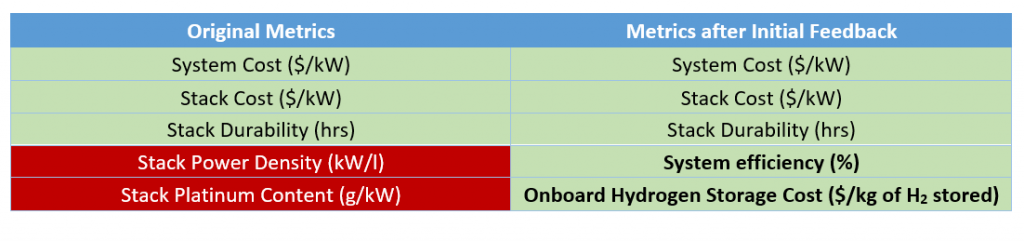
These changes also improved the alignment between light-duty and heavy-duty fuel cell metrics. Existing international targets for heavy-duty applications focus more on system level metrics rather than stack level performance such as power density. Experts agreed that targeting system efficiency was more important than stack power density because stacks are already achieving in the latter.
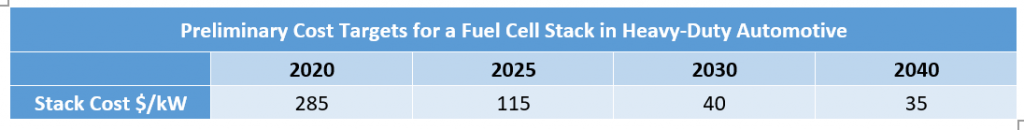
Industry feedback also highlighted a significant gap in the heavy-duty data specifically for fuel cell stack cost. I addressed this by applying the system to stack cost ratios calculated from the light-duty preliminary estimates.
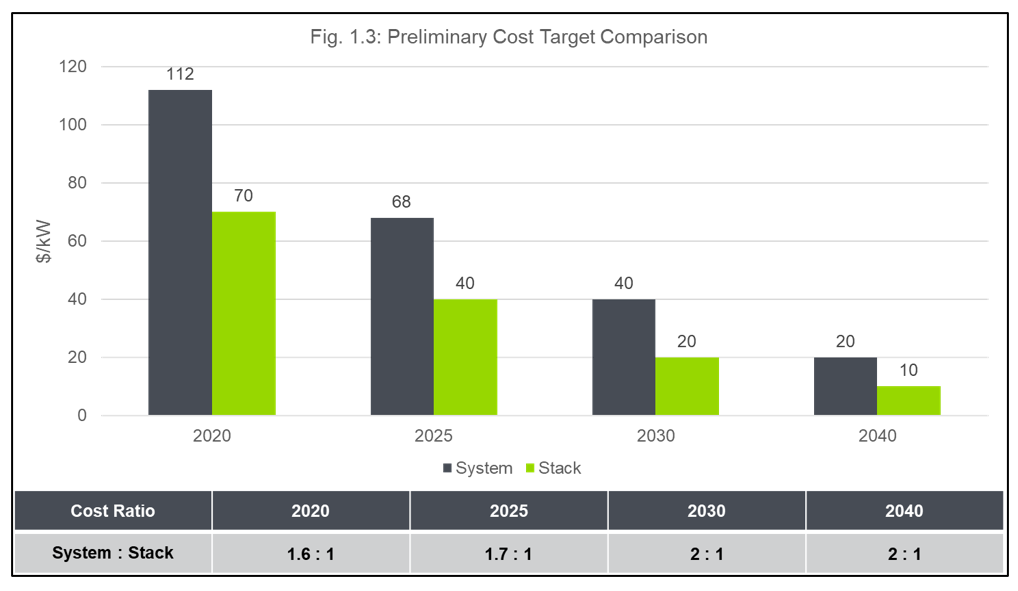
Using the above rations on existing heavy-duty system-level targets, I calculated the following:
The workshops were important in understanding where light-duty and heavy-duty fuel cell technology overlaps and where it does not. For example, the cost of on-board hydrogen storage was raised as a key metric that is common across both.
But what about the numbers?
Industry experts did voice their concerns that 2030 and 2040 cost indicators were too aggressive for both heavy-duty and light-duty automotive applications. In response to this, the Fuel Cell Technology Roadmap delays the 2030 system and stack indicators to 2035.
For onboard hydrogen storage, the opposite was the case and the $200/kg of H2 indicator has been brought forward from 2040 to 2035.
The system efficiency indicators generated the most debate. Initial estimates for “peak efficiency” exceeded 60% by 2030 and reached 70% by 2040. Industry experts highlighted that anything higher than 60% is already viewed as suspect. The laws of thermodynamics and a balance of achieving mass-market sensitive costs mean this is normally limited to below 65 – 70% at best.
However, industry agreed that these efficiencies were achievable if they were system-based at specific rated loads. These are a 25% rated load for PEMFC and an 80% rated load for SOFC. Consensus was also achieved in that efficiency indicators could be the same for both light-duty and heavy-duty fuel cell systems.
The end-product
Funnily enough, the 2020 fuel cell targets are not called “targets” in the new Fuel Cell Roadmap. They are now “Best-in-Class Balanced Indicators”, which sounds catchier in my view.
Anyway, what’s the difference? Basically none. These provide technology forecasts that industry is likely to achieve in a mass market competitive environment. They are balanced metrics based on the same technology or product, as opposed to a pick-and-mix of indicators across a range of similar sector products. For example, you can’t target a higher energy density with a battery cell high in nickel content and expect the cost to stay the same.
You may already be familiar with the 2017 Technology Roadmaps, and will know that cost and performance targets were set for different propulsion technologies in the automotive sector. These ranged from batteries to electric machines, but fuel cells were not covered at the time. The APC sees the new roadmap as an opportunity to align automotive requirements with developments in fuel cell technology and vice versa.
18 fuel cell experts have participated in constructive group discussions facilitated by APC ‘roadmappers’ Jon Regnart and Bhavik Shah. Feedback from the workshops has also led to valuable interviews with individual stakeholders. Collaboration with industry has been fundamental in delivering this new roadmap.
All technology indicators and roadmaps are a result of robust data analysis complemented by industry consensus. The APC is grateful for all the support received throughout the process.
Taking it a step further – the Roadmap Reports
To give some added context on what the Product and Technology Roadmaps mean, we have developed a report for each one. These give an added layer of depth, breaking them down and explaining the predictions set in greater detail.